Status : Published | Published On : Jul, 2021 | Report Code : VRHC1110 | Industry : Healthcare | Available Format :
![]() |
Page : 153 |
Industry Overview
The scar is a natural process of healing after an injury. There are different types of scars such as contracture scars, hypertrophic scars, acne scars, and keloid scars. The scar is treated with the help of over the counter drugs, injections, and surgical removal.
The global scar treatment market is predicted to grow at 12.1% CAGR during the forecast period with the market size reaching USD 40.6 billion by 2027.
Different types of products such as surface, laser, topical, and injectable are majorly contributing to the scar treatment market size. The market has witnessed significant demand for topical over the last few years due to cost effectiveness, easy application, easy availability, fewer side-effects, and greater acceptance of creams and gels for healing scars, such as burns, acne, and surgical marks.
Market Segmentation
Insight by Product
Based on the product, the scar treatment market is categorized into surface, laser, topical, and injectable of which topical hold the largest share in the scar treatment market, globally, and led to the fastest growth of the topical segment during the historical period, which is also predicted to continue during the forecast period owing to greater acceptance of creams and gels for healing scars, such as burns, acne, and surgical marks, easy availability, cost-effectiveness, fewer side-effects, and easy application.
The surface segment is further subdivided into chemical peeling, cryosurgery, and dermabrasion. Among all the surfaces, dermabrasion segment accounted the largest share and is expected to grow at the fastest rate in the market. Moreover, the laser segment is further subdivided into the CO2 laser, pulsed-dye laser, Erbium: YAG laser, and others. Among all the lasers, the CO2 laser segment accounted the largest share in the market.
In addition, the topical segment is further subdivided into oil, gel, cream, gel sheet, and others. Among the topical, the cream category holds the largest share in the market. The gel sheet segment is expected to grow at the fastest rate in the market. The injectable segment is further subdivided into the dermal filler and steroid injection. Among both injectables, the derma filler segment accounted the larger share and is expected to grow at a faster rate in the market during the forecast period.
Insight by Type of Scar
On the basis of the type of scar, the scar treatment market is segmented into acne scar, contracture scar, post-surgical scar, stretch mark, and keloid and hypertrophic scar. Of all, the keloid and hypertrophic scar category are predicted to witness the highest growth during the forecast period due to an escalating number of burn cases. Moreover, of all type of scar, post-surgical scar category accounted the largest share in the scar treatment market due to a mounting number of surgeries and an increasing number of road accidents.
Industry Dynamics
Growth Drivers
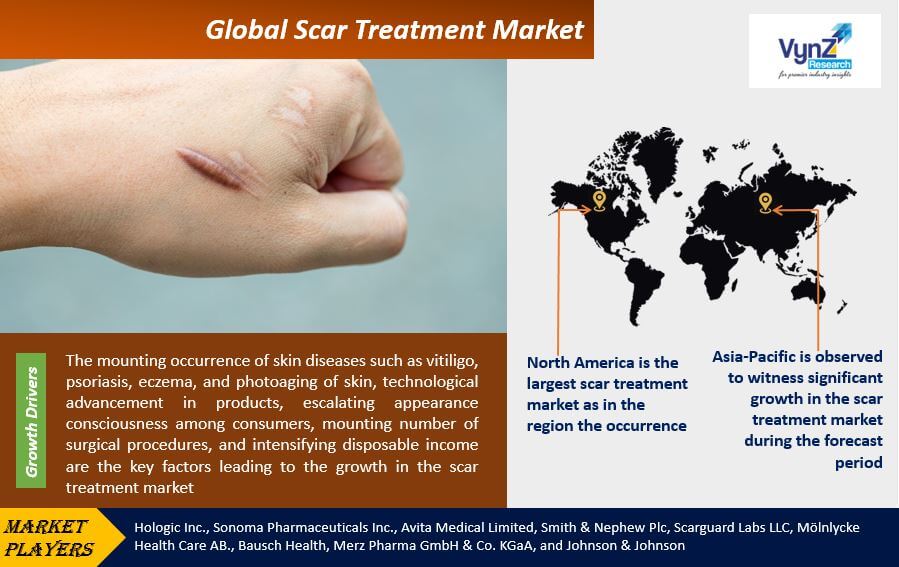
The mounting occurrence of skin diseases such as vitiligo, psoriasis, eczema, and photoaging of skin, technological advancement in products, escalating appearance consciousness among consumers, mounting number of surgical procedures, and intensifying disposable income are the key factors leading to the growth in the scar treatment market, globally. For instance, according to the American Academy of Dermatology, in the U.S., annually approximately 50 million Americans are suffering from acne.
Owing to the mounting disposable income, the upsurge in personal care spending has resulted, which further increases the demand for treatment of scars. Some of the other key factors driving the growth of the industry are mounting awareness about the treatment of scars, mounting healthcare expenditure, an increasing number of road accidents, and escalating demand for organic products for the treatment of scars.
Challenges
Key factors hindering the growth of the scar treatment market are the side effects of scare treatment products and therapies, and the high cost associated with scare treatment products.
Geographic Overview
Geographically, North America is the largest scar treatment market as in the region the occurrence of skin disease is increasing. In addition, mounting disposable income, a large number of players in the U.S. are focusing on R&D to introduce new products, and technological advancement in treatment products are also fueling the growth of the North American scar treatment market.
GLOBAL SCAR MARKET SHARE, BY REGION, 2017
Asia-Pacific is observed to witness significant growth in the scar treatment market during the forecast period, as the region comprises a large population. Moreover, mounting disposable income, mounting healthcare expenditure, improving healthcare infrastructure, expanding awareness regarding the treatment of scars, and escalating skin related problems are also facilitating the significant growth of Asia-Pacific scar treatment industry.
Competitive Insight
Market players in the scar treatment industry are investing capital to develop technologically advanced systems. In April 2017, Sonoma Pharmaceuticals, Inc. received regulatory approvals for Epicyn Scar Hydrogel from the United Arab Emirates Ministry of Health & Prevention, for the management of scars. Hologic Inc., Sonoma Pharmaceuticals Inc., Avita Medical Limited, Smith & Nephew Plc, Scarguard Labs LLC, Mölnlycke Health Care AB., Bausch Health, Merz Pharma GmbH & Co. KGaA, and Johnson & Johnson are some of the key players offering solutions for scar treatment.
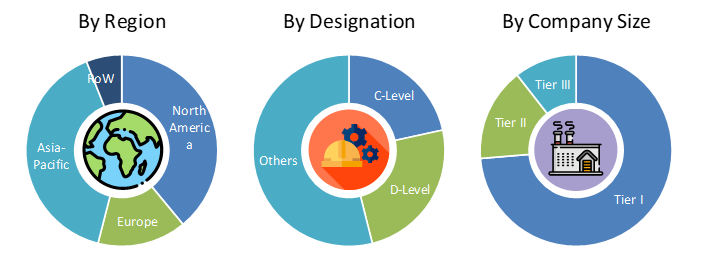
PRIMARY RESEARCH INTERVIEWS - BREAKDOWN
1. Research Overview
1.1. The Report Offers
1.2. Market Coverage
1.2.1. By Product
1.2.2. By Type of Scar
1.2.3. By Region
1.3. Research Phases
1.4. Limitations
1.5. Market Size Estimations and Forecast
1.5.1. Data Sources
1.5.1.1. Primary Research
1.5.1.2. Secondary Research
1.5.2. Methodology
1.5.2.1. Data Exploration
1.5.2.2. Forecast Parameters
1.5.2.3. Data Validation
1.5.2.4. Assumptions
1.5.3. Study Period & Data Reporting Unit
2. Executive Summary
3. Market Definition
3.1. By Product
3.1.1. Surface
3.1.1.1. Chemical Peeling
3.1.1.2. Dermabrasion
3.1.1.3. Cryosurgery
3.1.2. Laser
3.1.2.1. CO2 Laser
3.1.2.2. Erbium: YAG Laser
3.1.2.3. Pulsed-Dye Laser
3.1.2.4. Others
3.1.3. Topical
3.1.3.1. Oil
3.1.3.2. Gel
3.1.3.3. Gel Sheet
3.1.3.4. Cream
3.1.3.5. Others
3.1.4. Injectable
3.1.4.1. Dermal Filler
3.1.4.2. Steroid Injection
3.2. By Type of Scar
3.2.1. Acne Scar
3.2.2. Stretch Mark
3.2.3. Post-Surgical Scar
3.2.4. Contracture Scar
3.2.5. Keloid and Hypertrophic Scar
4. Industry Overview
4.1. Industry Dynamics
4.1.1. Major Drivers
4.1.2. Major Restraints
4.1.3. Key Trends
4.1.4. Key Opportunities
4.2. Industry Ecosystem
4.2.1. Regulatory Framework
4.2.2. Porter’s Five Forces Analysis
4.3. Competitive Insight
4.3.1. Competitive Analysis of Key Players
4.3.2. Product Analysis of Key Players
5. Global Market Estimate and Forecast
5.1. By Product
5.2. By Type of Scar
5.3. By Region
6. North America Market Estimate and Forecast
6.1. By Product
6.2. By Type of Scar
6.3. By Country
6.3.1. U.S. Market Estimate and Forecast
6.3.1.1. By Product
6.3.1.2. By Type of Scar
6.3.2. Canada Market Estimate and Forecast
6.3.2.1. By Product
6.3.2.2. By Type of Scar
6.3.3. Mexico Market Estimate and Forecast
6.3.3.1. By Product
6.3.3.2. By Type of Scar
7. Europe Market Estimate and Forecast
7.1. By Product
7.2. By Type of Scar
7.3. By End User
7.4. By Country
7.4.1. Germany Market Estimate and Forecast
7.4.1.1. By Product
7.4.1.2. By Type of Scar
7.4.2. U.K. Market Estimate and Forecast
7.4.2.1. By Product
7.4.2.2. By Type of Scar
7.4.3. France Market Estimate and Forecast
7.4.3.1. By Product
7.4.3.2. By Type of Scar
7.4.4. Italy Market Estimate and Forecast
7.4.4.1. By Product
7.4.4.2. By Type of Scar
7.4.5. Spain Market Estimate and Forecast
7.4.5.1. By Product
7.4.5.2. By Type of Scar
7.4.6. Rest of Europe Market Estimate and Forecast
7.4.6.1. By Product
7.4.6.2. By Type of Scar
8. Asia-Pacific Market Estimate and Forecast
8.1. By Product
8.2. By Type of Scar
8.3. By Country
8.3.1. Japan Market Estimate and Forecast
8.3.1.1. By Product
8.3.1.2. By Type of Scar
8.3.2. China Market Estimate and Forecast
8.3.2.1. By Product
8.3.2.2. By Type of Scar
8.3.3. India Market Estimate and Forecast
8.3.3.1. By Product
8.3.3.2. By Type of Scar
8.3.3. India Market Estimate and Forecast
8.3.3.1. By Product
8.3.3.2. By Type of Scar
8.3.4. Australia Market Estimate and Forecast
8.3.4.1. By Product
8.3.4.2. By Type of Scar
8.3.5. South Korea Market Estimate and Forecast
8.3.5.1. By Product
8.3.5.2. By Type of Scar
8.3.6. Rest of Asia-Pacific Market Estimate and Forecast
8.3.6.1. By Product
8.3.6.2. By Type of Scar
9. Rest of the World Market Estimate and Forecast
9.1. By Product
9.2. By Type of Scar
9.3. By Country
9.3.1. Brazil Market Estimate and Forecast
9.3.1.1. By Product
9.3.1.2. By Type of Scar
9.3.2. Saudi Arabia Market Estimate and Forecast
9.3.2.1. By Product
9.3.2.2. By Type of Scar
9.3.3. South Africa Market Estimate and Forecast
9.3.3.1. By Product
9.3.3.2. By Type of Scar
9.3.4. South Africa Market Estimate and Forecast
9.3.4.1. By Product
9.3.4.2. By Type of Scar
9.3.5. Other Countries Market Estimate and Forecast
9.3.5.1. By Product
9.3.5.2. By Type of Scar
10. Company Profiles
10.1. Hologic Inc.
10.1.1. Snapshot
10.1.2. Overview
10.1.3. Offerings
10.1.4. Financial Insight
10.1.5. Recent Developments
10.2. Sonoma Pharmaceuticals Inc.
10.2.1. Snapshot
10.2.2. Overview
10.2.3. Offerings
10.2.4. Financial Insight
10.2.5. Recent Developments
10.3. Avita Medical Limited
10.3.1. Snapshot
10.3.2. Overview
10.3.3. Offerings
10.3.4. Financial Insight
10.3.5. Recent Developments
10.4. Smith and Nephew PLC
10.4.1. Snapshot
10.4.2. Overview
10.4.3. Offerings
10.4.4. Financial Insight
10.4.5. Recent Developments
10.5. Scarguard Labs LLC
10.5.1. Snapshot
10.5.2. Overview
10.5.3. Offerings
10.5.4. Financial Insight
10.5.5. Recent Developments
10.6. Mölnlycke Health Care AB
10.6.1. Snapshot
10.6.2. Overview
10.6.3. Offerings
10.6.4. Financial Insight
10.6.5. Recent Developments
10.7. Bausch Health
10.7.1. Snapshot
10.7.2. Overview
10.7.3. Offerings
10.7.4. Financial Insight
10.7.5. Recent Developments
10.8. Merz Pharma GmbH & Co. KGaA
10.8.1. Snapshot
10.8.2. Overview
10.8.3. Offerings
10.8.4. Financial Insight
10.8.5. Recent Developments
10.9. Coloplast Corporation
10.9.1. Snapshot
10.9.2. Overview
10.9.3. Offerings
10.9.4. Financial Insight
10.9.5. Recent Developments
10.10. Johnson & Johnson
10.10.1. Snapshot
10.10.2. Overview
10.10.3. Offerings
10.10.4. Financial Insight
10.10.5. Recent Developments
Note: Financial insight are subject to availability of information in secondary domain.
11. Appendix
11.1. Exchange Rates
11.2. Abbreviation
List of Tables
Table 1 Sources
Table 2 Study Periods
Table 3 Data Reporting Unit
Table 4 Global Scar Treatment Market Size, by Product, 2015 – 2020 (USD Million)
Table 5 Global Scar Treatment Market Size, by Product, 2021 – 2027 (USD Million)
Table 6 Global Scar Treatment Market Size, by Type of Scar, 2015 – 2020 (USD Million)
Table 7 Global Scar Treatment Market Size, by Type of Scar, 2021 – 2027 (USD Million)
Table 8 Global Scar Treatment Market Size, by Region, 2015 – 2020 (USD Million)
Table 9 Global Scar Treatment Market Size, by Region, 2021 – 2027 (USD Million)
Table 10 North America Scar Treatment Market Size, by Product, 2015 – 2020 (USD Million)
Table 11 North America Scar Treatment Market Size, by Product, 2021 – 2027 (USD Million)
Table 12 North America Scar Treatment Market Size, by Type of Scar, 2015 – 2020 (USD Million)
Table 13 North America Scar Treatment Market Size, by Type of Scar, 2021 – 2027 (USD Million)
Table 14 North America Scar Treatment Market Size, by Country, 2015 – 2020 (USD Million)
Table 15 North America Scar Treatment Market Size, by Country, 2021 – 2027 (USD Million)
Table 16 U.S. Scar Treatment Market Size, by Product, 2015 – 2020 (USD Million)
Table 17 U.S. Scar Treatment Market Size, by Product, 2021 – 2027 (USD Million)
Table 18 U.S. Scar Treatment Market Size, by Type of Scar, 2015 – 2020 (USD Million)
Table 19 U.S. Scar Treatment Market Size, by Type of Scar, 2021 – 2027 (USD Million)
Table 20 Canada Scar Treatment Market Size, by Product, 2015 – 2020 (USD Million)
Table 21 Canada Scar Treatment Market Size, by Product, 2021 – 2027 (USD Million)
Table 22 Canada Scar Treatment Market Size, by Type of Scar, 2015 – 2020 (USD Million)
Table 23 Canada Scar Treatment Market Size, by Type of Scar, 2021 – 2027 (USD Million)
Table 20 Mexico Scar Treatment Market Size, by Product, 2015 – 2020 (USD Million)
Table 21 Mexico Scar Treatment Market Size, by Product, 2021 – 2027 (USD Million)
Table 22 Mexico Scar Treatment Market Size, by Type of Scar, 2015 – 2020 (USD Million)
Table 23 Mexico Scar Treatment Market Size, by Type of Scar, 2021 – 2027 (USD Million)
Table 24 Europe Scar Treatment Market Size, by Product, 2015 – 2020 (USD Million)
Table 25 Europe Scar Treatment Market Size, by Product, 2021 – 2027 (USD Million)
Table 26 Europe Scar Treatment Market Size, by Type of Scar, 2015 – 2020 (USD Million)
Table 27 Europe Scar Treatment Market Size, by Type of Scar, 2021 – 2027 (USD Million)
Table 28 Europe Scar Treatment Market Size, by Country, 2015 – 2020 (USD Million)
Table 29 Europe Scar Treatment Market Size, by Country, 2021 – 2027 (USD Million)
Table 30 Germany Scar Treatment Market Size, by Product, 2015 – 2020 (USD Million)
Table 31 Germany Scar Treatment Market Size, by Product, 2021 – 2027 (USD Million)
Table 32 Germany Scar Treatment Market Size, by Type of Scar, 2015 – 2020 (USD Million)
Table 33 Germany Scar Treatment Market Size, by Type of Scar, 2021 – 2027 (USD Million)
Table 34 U.K. Scar Treatment Market Size, by Product, 2015 – 2020 (USD Million)
Table 35 U.K. Scar Treatment Market Size, by Product, 2021 – 2027 (USD Million)
Table 36 U.K. Scar Treatment Market Size, by Type of Scar, 2015 – 2020 (USD Million)
Table 37 U.K. Scar Treatment Market Size, by Type of Scar, 2021 – 2027 (USD Million)
Table 38 France Scar Treatment Market Size, by Product, 2015 – 2020 (USD Million)
Table 39 France Scar Treatment Market Size, by Product, 2021 – 2027 (USD Million)
Table 40 France Scar Treatment Market Size, by Type of Scar, 2015 – 2020 (USD Million)
Table 41 France Scar Treatment Market Size, by Type of Scar, 2021 – 2027 (USD Million)
Table 42 Italy Scar Treatment Market Size, by Product, 2015 – 2020 (USD Million)
Table 43 Italy Scar Treatment Market Size, by Product, 2021 – 2027 (USD Million)
Table 44 Italy Scar Treatment Market Size, by Type of Scar, 2015 – 2020 (USD Million)
Table 45 Italy Scar Treatment Market Size, by Type of Scar, 2021 – 2027 (USD Million)
Table 46 Spain Scar Treatment Market Size, by Product, 2015 – 2020 (USD Million)
Table 47 Spain Scar Treatment Market Size, by Product, 2021 – 2027 (USD Million)
Table 48 Spain Scar Treatment Market Size, by Type of Scar, 2015 – 2020 (USD Million)
Table 49 Spain Scar Treatment Market Size, by Type of Scar, 2021 – 2027 (USD Million)
Table 50 RoE Scar Treatment Market Size, by Product, 2015 – 2020 (USD Million)
Table 51 RoE Scar Treatment Market Size, by Product, 2021 – 2027 (USD Million)
Table 52 RoE Scar Treatment Market Size, by Type of Scar, 2015 – 2020 (USD Million)
Table 53 RoE Scar Treatment Market Size, by Type of Scar, 2021 – 2027 (USD Million
Table 54 Asia-Pacific Scar Treatment Market Size, by Product, 2015 – 2020 (USD Million)
Table 55 Asia-Pacific Scar Treatment Market Size, by Product, 2021 – 2027 (USD Million)
Table 56 Asia-Pacific Scar Treatment Market Size, by Type of Scar, 2015 – 2020 (USD Million)
Table 57 Asia-Pacific Scar Treatment Market Size, by Type of Scar, 2021 – 2027 (USD Million)
Table 58 Asia-Pacific Scar Treatment Market Size, by Country, 2015 – 2020 (USD Million)
Table 59 Asia-Pacific Scar Treatment Market Size, by Country, 2021 – 2027 (USD Million)
Table 60 Japan Scar Treatment Market Size, by Product, 2015 – 2020 (USD Million)
Table 61 Japan Scar Treatment Market Size, by Product, 2021 – 2027 (USD Million)
Table 62 Japan Scar Treatment Market Size, by Type of Scar, 2015 – 2020 (USD Million)
Table 63 Japan Scar Treatment Market Size, by Type of Scar, 2021 – 2027 (USD Million)
Table 64 China Scar Treatment Market Size, by Product, 2015 – 2020 (USD Million)
Table 65 China Scar Treatment Market Size, by Product, 2021 – 2027 (USD Million)
Table 66 China Scar Treatment Market Size, by Type of Scar, 2015 – 2020 (USD Million)
Table 67 China Scar Treatment Market Size, by Type of Scar, 2021 – 2027 (USD Million)
Table 68 India Scar Treatment Market Size, by Product, 2015 – 2020 (USD Million)
Table 69 India Scar Treatment Market Size, by Product, 2021 – 2027 (USD Million)
Table 70 India Scar Treatment Market Size, by Type of Scar, 2015 – 2020 (USD Million)
Table 71 India Scar Treatment Market Size, by Type of Scar, 2021 – 2027 (USD Million)
Table 72 Australia Scar Treatment Market Size, by Product, 2015 – 2020 (USD Million)
Table 73 Australia Scar Treatment Market Size, by Product, 2021 – 2027 (USD Million)
Table 74 Australia Scar Treatment Market Size, by Type of Scar, 2015 – 2020 (USD Million)
Table 75 Australia Scar Treatment Market Size, by Type of Scar, 2021 – 2027 (USD Million)
Table 76 South Korea Scar Treatment Market Size, by Product, 2015 – 2020 (USD Million)
Table 77 South Korea Scar Treatment Market Size, by Product, 2021 – 2027 (USD Million)
Table 78 South Korea Scar Treatment Market Size, by Type of Scar, 2015 – 2020 (USD Million)
Table 79 South Korea Scar Treatment Market Size, by Type of Scar, 2021 – 2027 (USD Million)
Table 80 Rest of Asia-Pacific Scar Treatment Market Size, by Product, 2015 – 2020 (USD Million)
Table 81 Rest of Asia-Pacific Scar Treatment Market Size, by Product, 2021 – 2027 (USD Million)
Table 82 Rest of Asia-Pacific Scar Treatment Market Size, by Type of Scar, 2015 – 2020 (USD Million)
Table 83 Rest of Asia-Pacific Scar Treatment Market Size, by Type of Scar, 2021 – 2027 (USD Million)
Table 84 RoW Scar Treatment Market Size, by Product, 2015 – 2020 (USD Million)
Table 85 RoW Scar Treatment Market Size, by Product, 2021 – 2027 (USD Million)
Table 86 RoW Scar Treatment Market Size, by Type of Scar, 2015 – 2020 (USD Million)
Table 87 RoW Scar Treatment Market Size, by Type of Scar, 2021 – 2027 (USD Million)
Table 88 RoW Scar Treatment Market Size, by Country, 2015 – 2020 (USD Million)
Table 89 RoW Scar Treatment Market Size, by Country, 2021 – 2027 (USD Million)
Table 90 Brazil Scar Treatment Market Size, by Product, 2015 – 2020 (USD Million)
Table 91 Brazil Scar Treatment Market Size, by Product, 2021 – 2027 (USD Million)
Table 92 Brazil Scar Treatment Market Size, by Type of Scar, 2015 – 2020 (USD Million)
Table 93 Brazil Scar Treatment Market Size, by Type of Scar, 2021 – 2027 (USD Million)
Table 94 South Africa Scar Treatment Market Size, by Product, 2015 – 2020 (USD Million)
Table 95 South Africa Scar Treatment Market Size, by Product, 2021 – 2027 (USD Million)
Table 96 South Africa Scar Treatment Market Size, by Type of Scar, 2015 – 2020 (USD Million)
Table 97 South Africa Scar Treatment Market Size, by Type of Scar, 2021 – 2027 (USD Million)
Table 92 Saudi Arabia Scar Treatment Market Size, by Product, 2015 – 2020 (USD Million)
Table 99 Saudi Arabia Scar Treatment Market Size, by Product, 2021 – 2027 (USD Million)
Table 100 Saudi Arabia Scar Treatment Market Size, by Type of Scar, 2015 – 2020 (USD Million)
Table 101 Saudi Arabia Scar Treatment Market Size, by Type of Scar, 2021 – 2027 (USD Million)
Table 102 U.A.E. Scar Treatment Market Size, by Product, 2015 – 2020 (USD Million)
Table 103 U.A.E. Scar Treatment Market Size, by Product, 2021 – 2027 (USD Million)
Table 104 U.A.E. Scar Treatment Market Size, by Type of Scar, 2015 – 2020 (USD Million)
Table 105 U.A.E. Scar Treatment Market Size, by Type of Scar, 2021 – 2027 (USD Million)
Table 106 Other Countries Scar Treatment Market Size, by Product, 2015 – 2020 (USD Million)
Table 107 Other Countries Scar Treatment Market Size, by Product, 2021 – 2027 (USD Million)
Table 108 Other Countries Scar Treatment Market Size, by Type of Scar, 2015 – 2020 (USD Million)
Table 109 Other Countries Scar Treatment Market Size, by Type of Scar, 2021 – 2027 (USD Million)
Table 110 Snapshot – Hologic Inc.
Table 111 Snapshot – Sonoma Pharmaceuticals Inc.
Table 112 Snapshot – Avita Medical Limited
Table 113 Snapshot – Smith and Nephew PLC
Table 114 Snapshot – Scarguard Labs LLC
Table 115 Snapshot – Mölnlycke Health Care AB
Table 116 Snapshot – Bausch Health
Table 117 Snapshot – Merz Pharma GmbH & Co. KGaA
Table 118 Snapshot – Coloplast Corporation
Table 119 Snapshot – Johnson & Johnson
List of Figures
Figure 1 Market Coverage
Figure 2 Research Phases
Figure 3 Secondary Sources for Different Parameters
Figure 4 Methodology
Figure 5 Data Mining & Exploration
Figure 6 Data Triangulation
Figure 7 Assumptions for Market Estimation and Forecast
Figure 8 Market Synopsis
Figure 9 Global Scar Treatment Market - Growth Drivers and Restraints
Figure 10 Competitive Benchmark
Figure 11 Global Scar Treatment Market Highlight
Figure 12 Global Scar Treatment Market Size, by Product, 2015 – 2027 (USD Million)
Figure 13 Global Scar Treatment Market Size, by Type of Scar, 2015 – 2027 (USD Million)
Figure 14 Global Scar Treatment Market Size, by Region, 2015 – 2027 (USD Million)
Figure 16 North America Scar Treatment Market Highlight
Figure 17 North America Scar Treatment Market Size, by Product, 2015 – 2027 (USD Million)
Figure 18 North America Scar Treatment Market Size, by Type of Scar, 2015 – 2027 (USD Million)
Figure 19 North America Scar Treatment Market Size, by Country, 2015 – 2027 (USD Million)
Figure 20 U.S. Scar Treatment Market Size, by Product, 2015 – 2027 (USD Million)
Figure 21 U.S. Scar Treatment Market Size, by Type of Scar, 2015 – 2027 (USD Million)
Figure 22 Canada Scar Treatment Market Size, by Product, 2015 – 2027 (USD Million)
Figure 23 Canada Scar Treatment Market Size, by Type of Scar, 2015 – 2027 (USD Million)
Figure 24 Mexico Scar Treatment Market Size, by Product, 2015 – 2027 (USD Million)
Figure 25 Mexico Scar Treatment Market Size, by Type of Scar, 2015 – 2027 (USD Million)
Figure 26 Europe Scar Treatment Market Highlight
Figure 27 Europe Scar Treatment Market Size, by Product, 2015 – 2027 (USD Million)
Figure 28 Europe Scar Treatment Market Size, by Type of Scar, 2015 – 2027 (USD Million)
Figure 29 Europe Scar Treatment Market Size, by Country, 2015 – 2027 (USD Million)
Figure 30 Germany Scar Treatment Market Size, by Product, 2015 – 2027 (USD Million)
Figure 31 Germany Scar Treatment Market Size, by Type of Scar, 2015 – 2027 (USD Million)
Figure 32 U.K. Scar Treatment Market Size, by Product, 2015 – 2027 (USD Million)
Figure 33 U.K. Scar Treatment Market Size, by Type of Scar, 2015 – 2027 (USD Million)
Figure 34 France Scar Treatment Market Size, by Product, 2015 – 2027 (USD Million)
Figure 35 France Scar Treatment Market Size, by Type of Scar, 2015 – 2027 (USD Million)
Figure 36 Italy Scar Treatment Market Size, by Product, 2015 – 2027 (USD Million)
Figure 37 Italy Scar Treatment Market Size, by Type of Scar, 2015 – 2027 (USD Million)
Figure 38 Spain Scar Treatment Market Size, by Product, 2015 – 2027 (USD Million)
Figure 39 Spain Scar Treatment Market Size, by Type of Scar, 2015 – 2027 (USD Million)
Figure 40 Rest of Europe Scar Treatment Market Size, by Product, 2015 – 2027 (USD Million)
Figure 41 Rest of Europe Scar Treatment Market Size, by Type of Scar, 2015 – 2027 (USD Million)
Figure 42 Asia-Pacific Scar Treatment Market Highlight
Figure 43 Asia-Pacific Scar Treatment Market Size, by Product, 2015 – 2027 (USD Million)
Figure 44 Asia-Pacific Scar Treatment Market Size, by Type of Scar, 2015 – 2027 (USD Million)
Figure 45 Asia-Pacific Scar Treatment Market Size, by Country, 2015 – 2027 (USD Million)
Figure 46 Japan Scar Treatment Market Size, by Product, 2015 – 2027 (USD Million)
Figure 47 Japan Scar Treatment Market Size, by Type of Scar, 2015 – 2027 (USD Million)
Figure 48 China Scar Treatment Market Size, by Product, 2015 – 2027 (USD Million)
Figure 49 China Scar Treatment Market Size, by Type of Scar, 2015 – 2027 (USD Million)
Figure 50 India Scar Treatment Market Size, by Product, 2015 – 2027 (USD Million)
Figure 51 India Scar Treatment Market Size, by Type of Scar, 2015 – 2027 (USD Million)
Figure 52 Australia Scar Treatment Market Size, by Product, 2015 – 2027 (USD Million)
Figure 53 Australia Scar Treatment Market Size, by Type of Scar, 2015 – 2027 (USD Million)
Figure 54 South Korea Scar Treatment Market Size, by Product, 2015 – 2027 (USD Million)
Figure 55 South Korea Scar Treatment Market Size, by Type of Scar, 2015 – 2027 (USD Million)
Figure 56 Rest of Asia-Pacific Scar Treatment Market Size, by Product, 2015 – 2027 (USD Million)
Figure 57 Rest of Asia-Pacific Scar Treatment Market Size, by Type of Scar, 2015 – 2027 (USD Million)
Figure 58 RoW Scar Treatment Market Highlight
Figure 59 RoW Scar Treatment Market Size, by Product, 2015 – 2027 (USD Million)
Figure 60 RoW Scar Treatment Market Size, by Type of Scar, 2015 – 2027 (USD Million)
Figure 61 RoW Scar Treatment Market Size, by Country, 2015 – 2027 (USD Million)
Figure 62 Brazil Scar Treatment Market Size, by Product, 2015 – 2027 (USD Million)
Figure 63 Brazil Scar Treatment Market Size, by Type of Scar, 2015 – 2027 (USD Million)
Figure 64 South Africa Scar Treatment Market Size, by Product, 2015 – 2027 (USD Million)
Figure 65 South Africa Scar Treatment Market Size, by Type of Scar, 2015 – 2027 (USD Million)
Figure 66 Saudi Arabia Scar Treatment Market Size, by Product, 2015 – 2027 (USD Million)
Figure 67 Saudi Arabia Scar Treatment Market Size, by Type of Scar, 2015 – 2027 (USD Million)
Figure 68 U.A.E Scar Treatment Market Size, by Product, 2015 – 2027 (USD Million)
Figure 69 U.A.E Scar Treatment Market Size, by Type of Scar, 2015 – 2027 (USD Million)
Figure 70 Other Countries Scar Treatment Market Size, by Product, 2015 – 2027 (USD Million)
Figure 71 Other Countries Scar Treatment Market Size, by Type of Scar, 2015 – 2027 (USD Million)
Global Scar Treatment Market Coverage
Product Insight and Forecast 2015-2027
Type of Scar Insight and Forecast 2015-2027
Geographical Segmentation
Scar Treatment Market by Region
North America
Europe
Asia-Pacific
Rest of the World
Vynz Research know in your business needs, you required specific answers pertaining to the market, Hence, our experts and analyst can provide you the customized research support on your specific needs.
After the purchase of current report, you can claim certain degree of free customization within the scope of the research.
Please let us know, how we can serve you better with your specific requirements to your research needs. Vynz research promises for quick reversal for your current business requirements.