Cold Chain Market Overview
The Global Cold Chain Market is projected to witness substantial growth in the forecast period, with a valuation of USD 218.0 billion in 2023, estimated to soar to USD 322.2 billion by 2030, with a noteworthy CAGR 8.0%.
Cold chain refers to the temperature-controlled supply chain that allows continual storage and delivery of refrigerated products.
One of the vital elements in food processing is storing them. So, refrigeration is necessary and plays a crucial role in retaining freshness, food value, safety, and quality. These systems help maintain the ideal temperatures all over the supply chain to help in food preservation by eliminating chances of contamination and growth of microbes on the food items and enhancement of their shelf life.
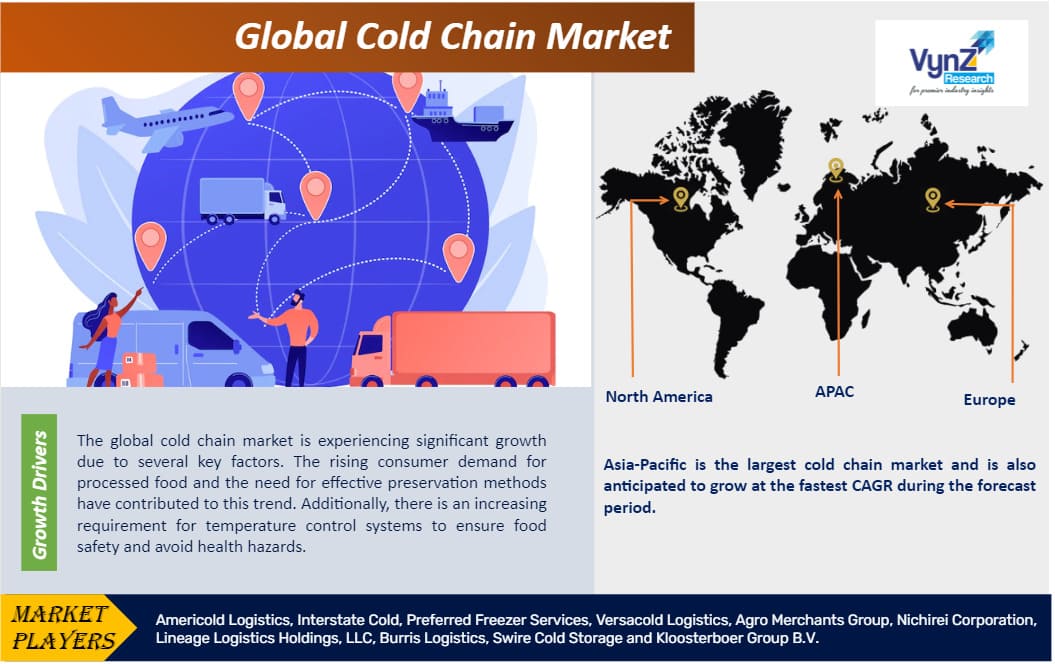
Several key factors will propel the growth of the global cold chain market in the projected period such as the increasing demand for temperature control systems to alleviate health risks. Moreover, the upsurge in e-commerce especially in the retail and food and beverage industry will propel the growth further to improve logistics and maintain the efficiency of the cold chain. The growing adoption of online distribution channels will also influence the market expansion.
In addition to that, the growing demand for processed food items or convenience food all over the globe will also influence the growth of the global cold chain market.
This specific market has witnessed several mergers and acquisitions which have propelled the growth of the global cold chain market. Stricter government regulations imposed on the storage and distribution of perishable goods and the need to adhere to them have also enhanced the growth prospects of the global cold chain market despite the existence of alternative storage solutions in many different scenarios, though in limited numbers and for limited types of goods.
Cold Chain Market Segmentation
Insight by Type
Depending on the type, the global cold chain market is divided into refrigerated storage and refrigerated transport segments. Out of these two segments, the former accounts for a large share of the market due to the high demand for processed food and the need to cater to the growing needs of the large global population base.
On the other hand, the demand for refrigerated transport is also expected to grow at a high CAGR during the forecast period due to the rise in demand for processed food.
Insight by Application
According to the application or deployment type, the global cold chain market is divided into bakery & confectionery, fish, meat & seafood, fruits & vegetables, dairy & frozen desserts, and other segments.
Out of all these segments, the size of the global cold chain market for the fish, meat & seafood segment will be larger during the forecast period due to the higher dependence of the large global population on animal-based food items. It is also attributed to the growing need to prevent contamination by microorganisms, which needs storing food items at a very low temperature. On the other hand, the dairy & frozen desserts segment will grow at the fastest rate during the forecast period.
Insight by Temperature Type
The global cold chain market is also divided by the temperature type. Ideally, the categories are chilled (0°C to 15°C), frozen (-18°C to -25°C), and deep-frozen (below -25°C).
Out of these three segments, it is the frozen segment that dominates the market overall in terms of revenue contribution which was about 61% in 2023 and is expected to grow at a high CAGR of 20% or so during the forecast period. This is mainly due to the higher need for frozen cold chain solutions to preserve the quality of perishable goods like poultry, cakes & bread, and meat, and even pharmaceutical products. The widespread availability of this solution also helps in the growth of this segment.
On the other hand, the chilled segment is expected to grow during the forecast period at a considerably high CAGR due to the high requirement of this solution to preserve freshness and retain high-quality perishable dairy products to increase their shelf life and minimize waste. The share of the Asia-Pacific region in this specific segment is expected to be higher than in other regions.
Global Cold Chain Market Report Coverage
|
Report Metric
|
Details
|
|
Historical Period
|
2020 - 2024
|
|
Base Year Considered
|
2025
|
|
Forecast Period
|
2026 - 2035
|
|
Market Size in 2025
|
U.S.D. 218.0 Billion
|
|
Revenue Forecast in 2035
|
U.S.D. 322.2 Billion
|
|
Growth Rate
|
8.0%
|
|
Segments Covered in the Report
|
By Type and By Application
|
|
Report Scope
|
Market Trends, Drivers, and Restraints; Revenue Estimation and Forecast; Segmentation Analysis; Companies’ Strategic Developments; Market Share Analysis of Key Players; Company Profiling
|
|
Regions Covered in the Report
|
North America, Europe, Asia-Pacific, Middle East, and Rest of the World
|
Industry Dynamics
Cold Chain Industry Trends
The major players in the cold chain market are investing a huge amount of capital in the research and development of technologically improved systems and their adoption to reduce greenhouse emissions while using energy-efficient refrigeration systems.
It is also seen that major players are trying to reduce fuel costs and increase the efficiency of cold-chain refrigeration by opting for intermodal transportation. This is a more sustainable solution that helps reduce carbon footprint in the process.
People today tend to visit them once a week or even less. They buy their necessary, vegetables, fruits, fish, meat, and other dairy products and food items in bulk till the time they visit the store the next time. So it is necessary to ensure that food items have a longer shelf life, which has augmented the significance and utility of the cold chain market.
There is also a growing trend among people to purchase perishable food products online. This demands innovative solutions such as automated warehouses, last-mile delivery, better inventory management and handling, and better temperature monitoring systems to guarantee the safety of fresh food products.
This has resulted in the rise in demand for innovative technologies for preserving perishable goods and extending their shelf life to meet the demand for processed food by people who are now more aware than before regarding food safety and nutritional value and their impact on general wellness.
There is also increased spending on cutting-edge technologies such as IoT and cloud computing and IT spending in cold storage logistics over the period. This ensures better inventory management, improved food storage and distribution, enhanced efficiency of cold chain supply systems, and real-time monitoring, reducing the risk of food contamination, spoilage, waste, and recalls.
There is also a moderate level of mergers and acquisitions, strategic alliances, and collaborations to extend business and service offerings, fortify presence over a region, and improve cold chain supply capabilities.
End-user concentration is also noticed at a significantly higher level in the cold chain market, especially in the food and pharmaceutical segments to ensure the integrity of products. Such dependency has resulted in a higher level of end-user concentration.
All these trends and activities influence market consolidation and operative synergies.
Cold Chain Market Growth Drivers
One of the most significant factors that influence the growth of the global cold chain market is the growing demand by consumers for processed food. It is also attributed to the growing need for preserving food using more efficient preservation methods.
Moreover, the increase in the need for better temperature control systems has also fueled the growth of the global cold chain market because it assures the safety of food and helps prevent health hazards.
Additionally, the growing adoption of e-commerce in the food and beverage industry has also played a crucial role in influencing the expansion of the global cold chain market.
The growing awareness among people and their desire for convenience or processed food items with zero microbial contamination, minimal use of chemical preservatives, 100% nutritional value, and optimal organic quality have increased the need for refrigeration of food items more efficiently, especially in the supply chain industry.
This has further propelled the growth of the global cold chain market since these systems allow proper storage and distribution of food items. Also, rapid urbanization and the change in the lifestyle of people resulted in infrequent visits to grocery outlets or retail stores.
Moreover, the governments in several countries impose strict regulations regarding the storage and transportation of perishable goods to ensure they are safe to consume and are of the highest quality. To comply with these stringent regulations, the vendors need a robust and effective cold chain system, which can be accomplished with the help of IT systems. It deals with the compliance aspects because these specific systems help in real-time temperature and humidity level monitoring. It also helps a great deal in data analytics and location tracking.
Cold Chain Market Challenges
The high infrastructure cost and higher energy requirements of these systems hinder the growth of the global cold chain market. Also, the growing concern about the environmental impact due to the emission of greenhouse gases as well as the difficulties in maintaining the integrity of perishable goods during transportation is hindering the growth of this market.
Cold Chain Market Opportunities
Intermodal transportation is creating new opportunities for the global cold chain market to expand. This solution helps optimize fuel costs and improves efficiency and temperature control by involving multiple modes of transportation such as trucks, ships, and trains.
The increase in the number of merger and acquisition activities is also creating new opportunities for the market to grow. Such strategic alliance is the result of the rapidly improving technology and rivalry in the disjointed market that intensifies competition and poses a significant threat to the vendors. As a result, companies are investing more in joint ventures which improves efficiency and reduces carbon footprint at the same time.
Cold Chain Market Geographic Overview
North America accounts for the highest revenue share of the global cold chain market. It is also expected to maintain its dominance in the market during the forecast period due to the enhanced growth prospects for businesses that are willing to invest in this specific type of storage solution for the long term. Apart from that, there is a growing adoption of connected devices and a huge customer base in this region, both of which will drive the expansion of the global cold chain market over the projected period.
Asia-Pacific is the largest contributor to the cold chain market and is expected to hold its position during the forecast period. It is anticipated that the market in this region will grow at a higher CAGR during the analysis period due to the growing population and rapid urbanization in this region which has increased the demand for processed food.
Apart from that, the growth in Foreign Direct Investment (FDI) inflow in developing countries such as India, Indonesia, and Vietnam is also influencing the growth of the market leaders in the retail business in these countries.
Cold Chain Market Competitive Insight
Market players in the cold chain industry are investing capital to develop and adopt technologically advanced systems with lower greenhouse emission and energy efficient refrigeration systems. Americold Logistics, Interstate Cold, Preferred Freezer Services, Versacold Logistics, Agro Merchants Group, Nichirei Corporation, Lineage Logistics Holdings, LLC, Burris Logistics, Swire Cold Storage and Kloosterboer Group B.V. are some of the key players offering solutions in cold chain industry.
Nichirei Logistics Group Inc. is the temperature-controlled logistics group having a logistics network focused on transportation, delivery, and transfer centers, regional storage facilities having refrigerated warehouses, and having businesses in Europe, China and ASEAN. Nichirei Logistics Group Inc. is building a cold chain infrastructure that will decrease temporal and spatial gaps that takes place between harvest, production, and consumption.
Preferred Freezer Services is a provider for the growing demand for modern and efficient cold storage warehousing services. They are investing in the new state-of-the-art cold storage warehouse and distribution facilities to understand the increased needs of new and current customers.
Recent Developments by Key Players
Lineage Logistics shall expandits cold storage capacity in western Canada. that will boost its total capacity to more than 200,000 square feet and over 24,000 pallet positions. The facility in Calgary is designed to serve customers that export meat and other products to Asia and other international markets which shall meet the demand of existing customers and welcome new customers in need of export capability.
Americold collaborated with RSA Cold Chain and DP World to bring a new state-of-the-art cold chain logistics platform to Dubai worth USD 35 million with 40,000 pallet positions, in the Jebel Ali Free Zone (Jafza) in the Port of Jebel Ali in Dubai.
Primary Research
VynZ Research conducts extensive primary research to understand the market dynamics, validate market data and have key opinions from the industry experts. The key profiles approached within the industry includes, CEO, CFO, CTO, President, Vice President, Product Managers, Regional Heads and Others. Also, end user surveys comprising of consumers are also conducted to understand consumer behaviour.
The Cold Chain Market report offers a comprehensive market segmentation analysis along with an estimation for the forecast period 2025–2030.
Segments Covered in the Report
- By Type
- Refrigerated Transport
- Refrigerated Storage
- By Application
- Bakery & Confectionery
- Fish, Meat & Seafood
- Fruits & Vegetables
- Dairy & Frozen Desserts
- Others
Region Covered in the Report
- North America
- Europe
- Germany
- U.K.
- France
- Italy
- Spain
- Russia
- Rest of Europe
- Asia-Pacific (APAC)
- China
- Japan
- India
- South Korea
- Rest of Asia-Pacific
- Rest of the World (RoW)
- Brazil
- Saudi Arabia
- South Africa
- U.A.E.
- Other Countries
.png "Cold Chain Market Size")
Source: VynZ Reseach
.png "Cold Chain Market Analysis")
Source: VynZ Reseach
