TIC Market for Energy & Power Industry Overview
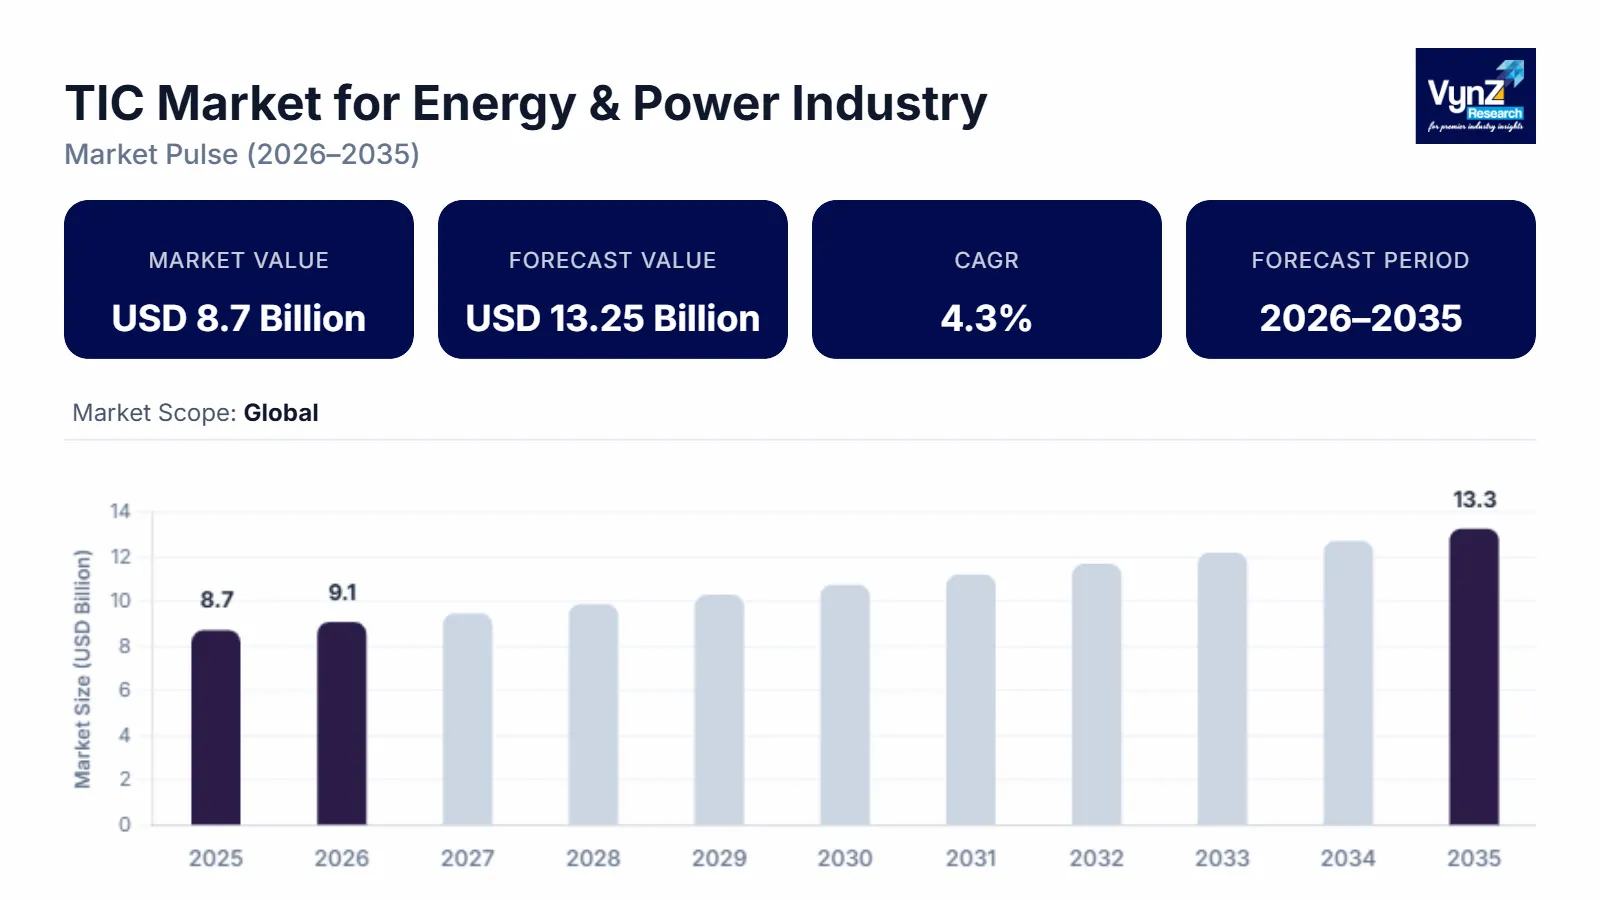
In the Energy and Power Industry, The Market For Testing, Inspection, and Certification (TIC) was valued at approximately USD 8.7 billion in 2025 and is estimated to rise further rise to almost USD 9.07 billion by 2026, is projected to reach around USD 13.25 billion in 2035, expanding at a CAGR of about 4.3% during the forecast period 2026 to 2035.
TIC testing is a vital process that ensures the suitability of manufactured products, individual components, and multi-component systems for their intended purposes.
The Energy & Power sector's Testing, Inspection, and Certification (TIC) market offers independent technical services that guarantee power systems, equipment, and infrastructure adhere to performance, safety, and regulatory requirements. It includes certification in accordance with national and international standards, on-site inspection of generating facilities and transmission networks, and testing of mechanical and electrical components. TIC services are utilized by conventional power plants, grid infrastructure, smart energy systems, and renewable energy initiatives like as wind and solar. The main drivers of the business are aging infrastructure, stringent regulatory requirements, the rapid expansion of renewable energy, and the increased emphasis on environmental, social, and governance (ESG) compliance. There is an increasing need for remote inspection solutions, cybersecurity validation, and enhanced testing as power systems become more digital and decentralized. High technical proficiency, stringent accreditation standards, and a heavy reliance on outside suppliers to guarantee openness, dependability, and worldwide compliance in more intricate energy ecosystems are characteristics of this industry.
TIC Market for Energy & Power Industry Dynamics
Market Trends
Key market trends in the Energy & Power TIC sector include increasing digitalization with IoT and remote monitoring, stronger ESG and sustainability certification demand, rapid growth in renewables testing, cyber-security compliance for smart grids, and use of AI for predictive inspections. Regulatory tightening and global standard harmonization further drive sophisticated, data-driven TIC services.
Growth Drivers
Energy and power assets are the sources of a large part of the most stringent safety and performance regulations across any other industry, and these regulations are becoming more complex rather than less complex. Besides a wide range of performance tests and inspections, power plants, transmission networks, substations, and grid-connected assets must undergo compliance audits, which are demanded by regulators and grid operators. These requirements provide a base for a steady, recurring demand for third-party TIC services, with compliance-led activities accounted for approximately 36–38% of the total market demand, thus, the demand is largely independent power price cycles.
The scale and the age of the worldwide energy infrastructure are the other two major factors behind the market growth. The most of the base for thermal power, transmission lines, and substations, which have been installed globally, is the one that was mostly constructed some decades ago and now it needs frequent condition monitoring, life-extension testing, and safety validation. In 2023, the global investment in power infrastructure was more than USD 1.3 trillion and a very big part of this money is spent on the inspection and testing of the existing assets rather than on the new ones. The demand for TIC services related to asset integrity and operational safety is increasing at a rate of almost 7% yearly.
Moreover, the shift to renewable energy and decentralized power systems is still adding extra complications. Wind farms, solar plants, energy storage systems, and hybrid grids are the ones that need special testing, certification, and grid compliance verification. In contrast to conventional generation, renewable assets are required to meet both electrical and environmental performance standards. The demand for TIC that is mainly associated with renewable energy and grid integration activities, is outpacing the overall market and the growth rate is moving toward 8–9%.
Market Restraints / Challenges
The Energy & Power TIC market faces several challenges. High operating costs and the requirement for sophisticated technological knowledge, restrict the competitiveness of smaller suppliers. Certification procedures are complicated and duplicated due to national regulatory differences. Risks to cybersecurity and changing digital standards increase the difficulty of compliance. Additional compliance difficulties are brought on by cybersecurity threats and changing digital standards. Additionally, pricing pressure from large utilities and project developers affects margins. In emerging markets, limited infrastructure and inconsistent enforcement of standards can hinder growth and reduce demand for accredited third-party TIC services.
Market Opportunities
The global energy shift is driving significant growth potential in the Energy & Power TIC market. There is a growing need for specialist testing and certification services due to the rapid rise of renewable energy projects, including solar, wind, offshore wind, hydrogen, and energy storage. Smart grid implementation and grid modernization create chances for cybersecurity compliance and digital system validation. New certification services in sustainability and environmental performance are created by the growing demands for carbon verification and ESG reporting. In developed markets, aging infrastructure necessitates continuous asset integrity management and inspection. Accredited third-party TIC providers are in greater demand as emerging economies make investments in transmission and power generation infrastructure. Additionally, more effective, data-driven service models and recurring revenue streams are made possible by the use of AI, drones, and remote inspection technology.
Global TIC Market for Energy & Power Industry Report Coverage
|
Report Metric
|
Details
|
|
Historical Period
|
2020 - 2024
|
|
Base Year Considered
|
2025
|
|
Forecast Period
|
2026 - 2035
|
|
Market Size in 2025
|
U.S.D. 8.7 Billion
|
|
Revenue Forecast in 2035
|
U.S.D. 13.25 Billion
|
|
Growth Rate
|
4.3%
|
|
Segments Covered in the Report
|
Service Type, Sourcing Type, Energy Source and Asset type
|
|
Report Scope
|
Market Trends, Drivers, and Restraints; Revenue Estimation and Forecast; Segmentation Analysis; Companies’ Strategic Developments; Market Share Analysis of Key Players; Company Profiling
|
|
Regions Covered in the Report
|
North America, Europe, Asia Pacific
|
TIC Market for Energy & Power Industry Segmentation
By Service Type
Inspection services constitute the major part of TIC demand in the energy and power industry, that is, their share is around 42–44% of the total market revenue, and this is mainly because of the mandatory periodic checks of generation assets, transmission lines, and substations. Testing services have a share of about 34–36%, and the main drivers for that are electrical performance testing, material integrity assessment, and commissioning activities. Certification services are still at a smaller level of roughly 20–22%, but they are indispensable for grid compliance, safety approvals, and regulatory clearances.
By Sourcing Type
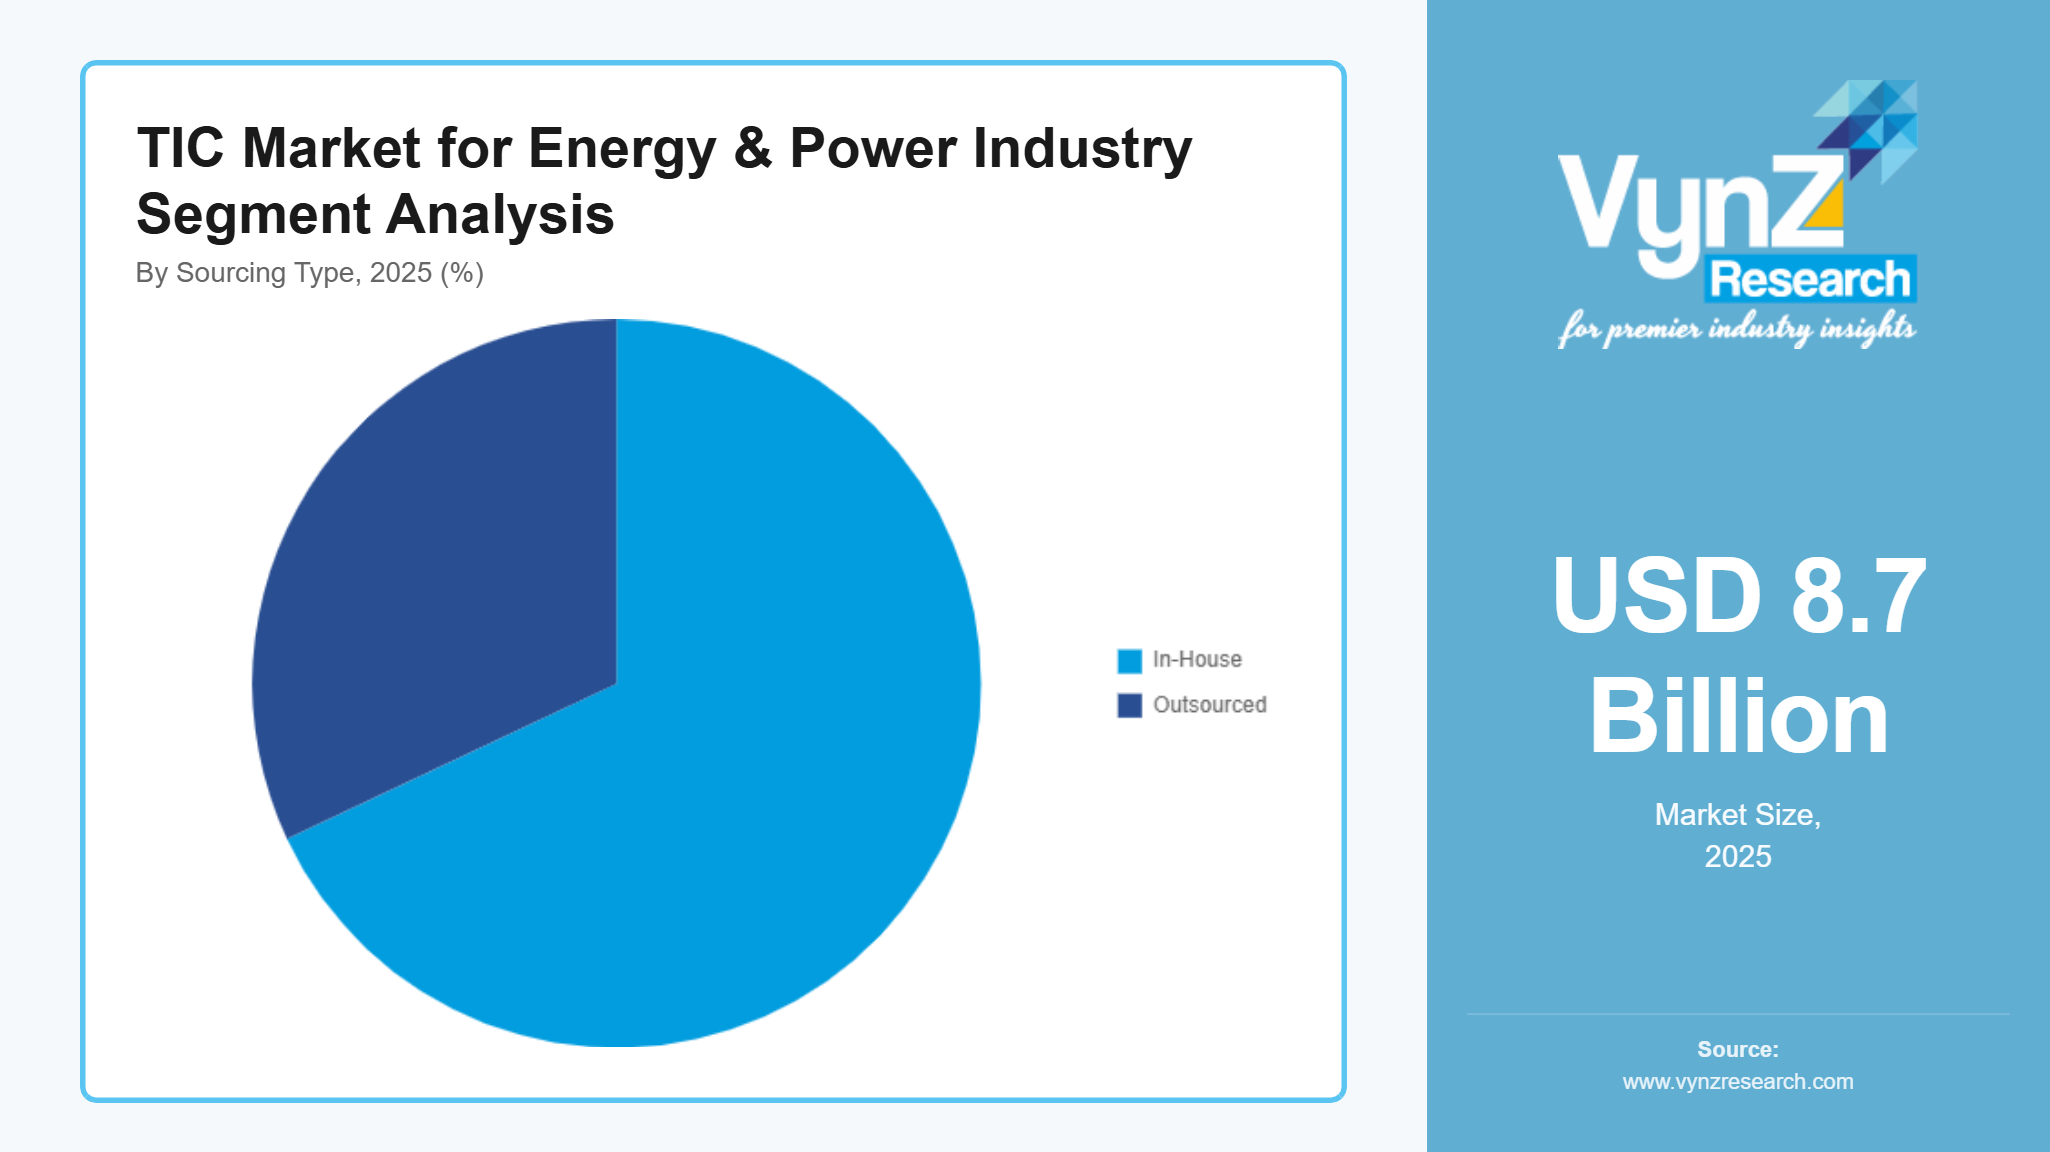
Outsourced TIC services are the main force in the market and have a share of nearly 66–68%, as utilities and power producers are more and more willing to engage independent providers for their specialized expertise and regulatory neutrality. Outsourced services are developing at a rate of approximately 7.3–7.6% CAGR. On the other hand, in-house TIC functions, which are mainly present in large utilities and national grid operators, make up the remainder of the demand and are growing at a slower pace of about 4.5%, with a large part of the activities being routine internal checks.
By Energy Source
Conventional power generation, which entails coal, gas, and nuclear, is still the major source of the highest TIC demand, thus, it is close to 48% of total service volume mainly due to complex safety and performance requirements. The third energy source comes next with a share of about 37% and is being supported by rapid capacity additions and grid integration testing. TIC demand related to the renewable energy sector increases at a much faster rate, i.e., almost 8.5% per year, while the nuclear-related TIC remains at a constant level, but highly specialized.
By Asset Type
Generation assets are responsible for about 46% of the TIC demand, which is mainly due to inspection and testing of turbines, boilers, generators, and auxiliary systems. On the other hand, the Transmission and distribution infrastructure is contributing approximately 38%, thus, supported by line inspection, substation testing, and grid reliability assessments. Energy storage and ancillary assets make a smaller share of the market today but the trend is positive and they are almost 9% CAGR growing as grid flexibility is gaining more and more importance.
Regional Insights
North America
North America is a mature and heavily regulated market for energy and power TIC services, and it accounts for about 30–32% of the worldwide revenue. The majority of regional demand is US-driven and it is sustained by the following factors: strict grid reliability standards, infrastructure aging, and strong enforcement by regulatory bodies.
Inspection and testing performed on a regular basis for transmission and distribution networks are a major part of TIC agency works, specially utilities investing in grid hardening and resilience. TIC services tied to the power infrastructure district are on the rise at an annual rate of about 6.5–6.8%, more driven by the asset maintenance than by the new capacity additions.
Growth is however also propelled by the extension of renewable energy, mainly propelled by wind and solar projects that require exhaustive grid compliance testing and certification.
Europe
Europe is responsible for about 26–28% of the global TIC demand in the energy and power sector and is mainly influenced by decarbonization policies and cross-border grid integration. The regulatory oversight here is mature, and there are uniform inspection and certification requirements for different member states.
The main factors of demand for renewable energy and energy efficiency initiatives are offshore wind, grid interconnections, and energy storage projects. The demand for TIC services related to renewable integration and grid stability is increasing at a rate of around 7–7.5% yearly.
At the same time, reduction in the use of and refurbishing of the aging thermal and nuclear assets, which is going on in the whole Europe, is still resulting in a steady demand for inspection and testing.
Asia Pacific
Asia Pacific is a regional market with the most rapid expansion and their CAGR is projected to be between 8 and 9%. The process of electrification, the industrial boom, as well as the deployment of large-scale renewable energy in China, India, and Southeast Asia have been the major factors of sustained demand for TIC services in the mentioned region.
Huge investments in the transmission networks and new generation capacities are paving the way for increased third-party inspection and testing providers use. The regulatory framework, which was once patchy, is becoming more uniform, particularly for grid-connected renewable assets and export-oriented equipment suppliers.
Therefore, the need for TIC in the region is moving away from project-based testing to the contracts for recurring compliance and performance monitoring.
Competitive Landscape / Company Insights
The chemical TIC market is moderately concentrated with strong global competitors and numerous regional specialists competing on service breadth, technical expertise, and regulatory alignment. Leading players dominate through extensive geographic coverage, diversified service portfolios, technological investments, and strategic partnerships or acquisitions to enhance capacity in chemical-specific testing and certification services.
Mini Profiles
Intertek is a leading provider of testing and analysis services to various industries. Intertek supports manufacturers of energy generation and distribution equipment with testing and certification solutions for access to global markets.
UL Solutions services cover the energy storage industry's entire value chain. Company is a leader in safety testing and certification for battery technology.
Intertek Group PLC is an UK-based TIC firm specializing in testing, safety assessments, and certification. Intertek supports energy equipment manufacturers and utilities with electrical testing, power systems validation, and renewable energy assurance. Its global footprint and innovation in testing programs help customers meet international standards.
DNV GL provides technical assurance and advisory services focused on energy sectors including offshore energy, renewables, and grid systems. It blends testing with risk and asset integrity management critical for power infrastructure and transition technologies.
Key Players
- Intertek Group Plc
- Bureau Veritas
- UL LLC
- SGS SA
- Eurofins USA
- TUV Rheinland
- DEKRA SE
- ALS Limited
- Applus+
- DNV GL
Recent Developments
In January 2026, UL Solutions has introduced a dedicated testing and certification framework for plug-in “balcony” solar systems, defining safety and performance requirements that support broader residential solar adoption in the United States. This initiative aims to create clearer safety standards for these small-scale solar products and help align legislation with certification criteria.
In November 2025 - Intertek Group Plc, a leading Total Quality Assurance provider to industries worldwide, has acquired Suplilab, a market-leading provider of food safety and medical devices testing services, based in San José, Costa Rica. Acquisition of Suplilab has given Intertek immediate access to attractive ATIC growth opportunities in Central America.
In December 2025 - Bureau Veritas Marine & Offshore (BV) has classed its first methanol-fueled containership, CMA CGM ANTIGONE. The 15,000 TEU methanol dual-fuel vessel was built by CSSC Jiangnan Shipyard for the CMA CGM Group.
