Video Streaming Market Overview
The global Video Streaming Market is projected to reach USD 697.2 billion by 2035 from USD 110.3 billion, registering a CAGR of 19.5% during the forecast period (2026-2035).
The growth of the global video streaming market is fuelled by different factors such as the rising demand for video streaming in mobile gadgets, an increase in the number of video streaming service providers, and the rise in internet reach, especially in developing countries. Video streaming refers to sending video material in compressed form instead of storing it in the hard drive of a computer or a mobile phone. It needs a reliable and constant internet connection to perform without buffering. This means users do not have to wait for a video to download and save it on the hard drive to play it back. It is mainly watching a video in real-time. Several viewers can watch this compressed video since these are usually pre-recorded. The device simply has to decompress it and play back. The quality of video streaming has been better over the years due to the implementation of AI, machine learning, and blockchain technology. These technologies have made all aspects of video making and streaming much easier, thereby contributing to market growth.

Video Streaming Market Segmentation
Insight by Solution
According to the solutions, the global video streaming market can be divided into Over the Top (OTT), Internet Protocol Television (IPTV), and Pay TV categories.
Out of all these, the OTT platforms are expected to grow significantly during the forecast period. This is mainly due to the rising demand, widespread applications, and a higher adoption rate. All these are made possible by the widespread use of smart devices such as smartphones, tablets, and laptops.
Insight by Platform Type
According to the different types of platforms, the global video streaming market can be segregated into smart TVs, smartphones, tablets, laptops, gaming consoles, and desktops. Out of these, the tablet and smartphone categories are expected to witness significant growth in the forecast period. Thereby pushing the global video streaming market upward. This is due to the development and launch of a larger number of mobile apps that have not only created greater opportunities for small businesses to enter into new markets and enhance their market base but also offer users a lot of convenience and flexibility in use.
Insight by Deployment Type
According to deployment type, the video streaming market can be divided into on-site and cloud-based categories. Among these two, the cloud-based video streaming market is expected to grow at a much faster rate than the other during the forecast period. This is mainly because cloud media streaming helps resolve compatibility issues and issues related to encoding video content. Most importantly, it allows easy accessibility to the users irrespective of their location and time of access.
Insight by Type
Based on video streaming type, the video streaming market can be divided into live linear streaming and video-on-demand streaming. Out of these two categories, the former has a larger market share and is expected to grow continually at a faster rate during the forecast period. This is mainly due to the benefits offered to the viewers such as time-shifting and ease of viewing. It is delivered directly, contrary to on-demand streaming. In addition to that, users do not have to create and follow any specific playlist to view videos. They can view the video that they want to when they are displayed.
Global Video Streaming Market Report Coverage
|
Report Metric
|
Details
|
|
Historical Period
|
2020 - 2024
|
|
Base Year Considered
|
2025
|
|
Forecast Period
|
2026 - 2035
|
|
Market Size in 2025
|
U.S.D. 110.3 Billion
|
|
Revenue Forecast in 2035
|
U.S.D. 697.2 Billion
|
|
Growth Rate
|
19.5%
|
|
Segments Covered in the Report
|
By Solution, By Platform Type, By Deployment Type, and By Type
|
|
Report Scope
|
Market Trends, Drivers, and Restraints; Revenue Estimation and Forecast; Segmentation Analysis; Companies’ Strategic Developments; Market Share Analysis of Key Players; Company Profiling
|
|
Regions Covered in the Report
|
North America, Europe, Asia-Pacific, Middle East, and Rest of the World
|
Industry Dynamics
Trends
One of the most significant trends noticed in the global video streaming market is the continual advancement of technology and the rising number of social media sites. Ideally, social media sites play a crucial role in the growth of the market and give it the right momentum due to the rise in the adoption of video content.
Moreover, several video streaming platforms are investing more and more in creating and streaming original content to attract new viewers and enhance their list of subscribers. They are also putting in a lot of effort to make their presence felt in the international markets to gain more subscribers worldwide.
Apart from that, service providers are also focusing on improving their localization efforts, which include dubbing, subtitles, and others that also help in gaining traction in several regions. They customize content offerings and even use user data and usage patterns to create personalized recommendations. These services are made even better with the use of machine learning and advanced algorithms so that they can produce content according to individual preferences.
Growth Drivers
One significant growth driver of the global video streaming market is the higher adoption of Video-as-a-Service (VaaS). This is mainly due to the low cost of ownership and higher requirement for transcoding to deliver videos to many viewers. There is also an increase in demand for online video content, on-demand streaming, the use of videos in corporate training programs, and more. VaaS is a low-latency connection and a high-capacity visual communication medium. Its easy installation and wider support enable the service providers to deliver HD video content. With the use of these systems, businesses can now use virtual receptionists to greet people during meetings and conferences or provide technical support to the team to ensure that the proceedings of the meetings are smooth. Therefore, VaaS is contributing significantly to the growth of the global video streaming market worldwide.
Video Streaming Market Restraints
The high development cost of video content, higher accuracy requirements, inclusion of graphics and animations, and the need for technical expertise by the person handling it impede the growth of the global video streaming market. Moreover, there are lots of issues and technical complexities involved in this, which also need reliable and strong network connectivity. It also hinders growth. However, these are all minor challenges, and a lot of initiatives are taken to alleviate them, which will propel the growth of the global video streaming market.
Video Streaming Market Geography Insight
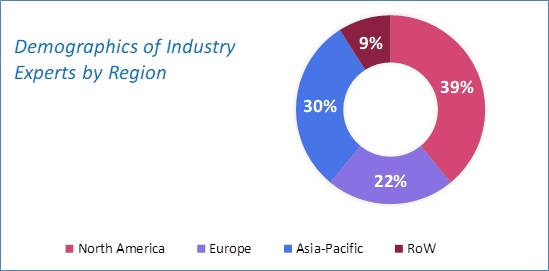
North America accounts for the largest share of the video streaming market and is also expected to grow at a significant rate during the forecast period. This will be mainly due to the higher adoption of video streaming services by US households, which results in higher revenue yield. Also, the widespread use of mobile phones and other devices to watch videos on the go has contributed to the growth in this region. Add to that, the extensive use of live videos in corporate training programs pertains to the growth of the global video streaming marketin North America. However, the global video streaming market in the Asia-Pacific countries will grow at the fastest rate due to the rise in popularity of this system in these regions. Social media companies are taking advantage of it and signing new contracts with media companies and celebrities to gain more subscribers.
Video Streaming Market Competitive Insight
Key players in the global video streaming market are investing more in improving the quality of videos and developing the latest technologies that are strengthening their position in the market. However, it has been observed that local players are depending upon new technology to develop cost efficiencies in their business operations, thus increasing the rivalry in the market to some extent.
Some of the key players operating in the global video streaming market are Akamai Technologies, Adobe Systems Incorporated, Amazon Web Services, Netflix, Inc., Ustream, Cisco Systems, Inc., Apple, Inc., Google Inc., Microsoft Corporation, and Hulu.
Recent Development by Key Players
Adobe has acquired Bengaluru-based Rephrase.ai (AI Video Creation Platform). Following the acquisition, a majority of Rephrase.ai's team members will join Adobe and the former’s investors will likely get a complete cash exit. This would help the tech giant accelerate its ability to provide AI-powered video content tools to its customers.
Recently, Netflix has joined hands with World Wrestling Entertainment (WWE), which is part of TKO Group Holdings, Inc. RAW, which airs on Mondays, is the top show on the Comcast-owned USA Network, with 17.5 million unique viewers over the course of the year. The rights deal that cost over $5 billion will span a period of 10 years. For the time being, RAW will be aired only in the United States, the United Kingdom, Canada and Latin America.
The Video Streaming Market report offers a comprehensive market segmentation analysis along with an estimation for the forecast period 2026–2035.
Segments Covered in the Report
- By Solution
- Internet Protocol Television
- Pay TV
- Over the Top
- By Platform Type
- Smartphones & Tablets
- Smart TV
- Laptops & Desktops
- Gaming Consoles
- By Deployment Type
- By Type
- Video-On-Demand Streaming
- Live Linear Streaming
- By End-User
- By Services
- Consulting
- Training & Support
- Managed Services
- By Revenue Model
- Subscription
- Rental
- Retail
Region Covered in the Report
- North America
- Europe
- Germany
- U.K.
- France
- Italy
- Spain
- Russia
- Rest of Europe
- Asia-Pacific (APAC)
- China
- Japan
- India
- South Korea
- Rest of Asia-Pacific
- Rest of the World (RoW)
- Brazil
- Saudi Arabia
- South Africa
- U.A.E.
- Other Countries
Source:VynZ Research
.png "Video Streaming Market Size")
Source:VynZ Research
